I think This video sums up what I think about bitcoin, I was recently suspended on Twitter for telling @maxkeiser that I thought his Bitcoin Fantasy was equivalent to Ass Pennies. He rallied his supporters to report and suspend me! What a douche. Anyhow I got my account back and went on to explain 6 different ways Bitcoin could flashcrash overnight and 10 different ways Bitcoin is a Ponzi Scheme .. check out my twitter page, handle is @nickj4848. I guarantee you will enjoy following my twitter.

For more recent posts Follow on Flipboard @goldmagazine or By Clicking the Flipboard widget below right.
Wednesday, March 27, 2013
Thursday, March 21, 2013
Harpooning oneself in the foot: The Japanese Bond Market Bubble, by Ah0707
Since
the post-WW2 period Japan has had 3 financial bubbles, two of which that have
popped in dramatic style. In 1989, the Nikkei 225 Stock index had risen to a
peak of 38.957.44 points only to have collapsed to below 8,000 points by 2003.
Around this same period, the price of Japanese Real Estate had fallen faster
than an elephant after being kicked out of a plane, with prices falling by as
much as 99% in Tokyo’s financial district. The combination of these bubbles
popping had wiped out tens of trillions of dollars, or more than half the
world’s GDP to put it into context.


These two
bubble pops, however will pale in comparison to the next one coming: Japanese
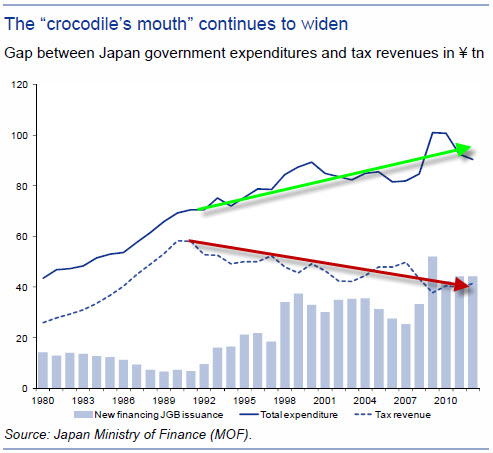
Bonds. To set a bit of context, the Japanese government, in order to stimulate
the economy back in the early 90s, had effectively begun printing money
(issuing bonds) at such a frenetic pace (and has continued unabated for the
last two decades) that the amount of government bonds issued far out-stripped
the amount of tax revenue they receive from Japanese citizens. At the moment
Japan’s government gross debt sits at 240% of GDP (More fun if we start talking
though in terms of Yen, Quadrillions of it).


While even
getting to this mark does seem logically-defying for any rational thinking
human being, what made this possible up until now were three key factors: A
large pool of savings, low interest rates, and a postive trade surplus
(earnings from exports are greater than the costs of imports).
At face
level, the following statistics could put one’s mind at ease that there is no
crisis to really worry about: Japanese have $19 trillion dollars in savings and
90% of Japanese Government Bonds are held domestically, so say if China or the
US were to decide to dump their holdings in Japanese Government Bonds, it would
not lead to a collapse in the Japanese economy. In addition overnight cash
interest rates are around 0.1% per annum, which is the lowest rate amongst all
the major central banks in the world. The below link attests this:
All good? Not quite.
Let us start
with the savings rate: During the hey-days of the late 80s and early 90s, Japan
had a savings rate of around 15 to 25%. Today it is under 3%. The two main
causes are: a) declining asset prices (i.e. deflation), and b) an ageing
population. We have effectively touched on the asset price collapse over the
last two decades with the real estate and stock market bubbles, so we will
focus on the impact of the aging population. More than 23% of Japan’s
population are above the retirement age of 65 (compare that to 11.6% in 1989),
and as the chart clearly shows below, there is a direct correlation between the
decline in the working age population and the rate of economic growth (makes
sense - less able workers, less production…).

Apart from having
a lower proportion of the population in the workforce, pension funds and
insurance companies have had to start selling their Japanese Government Bond
(JGB) holdings in order to payout the retirement benefits that are owed. This
leads to the servicability of debt becoming more difficult (seriously who wants
to put their money into savings that would only get you next to nothing in
interest?). To ascertain the degree of desperation of those governing the
finances of the nation, one “remedial” solution proposed by the new (but don’t
know for how long) finance minster Aso Taro was to ask the elderly to “hurry up
and die” http://www.guardian.co.uk/world/2013/jan/22/elderly-hurry-up-die-japanese in order to reduce the cost of social welfare (18% of national income
currently, 27% by 2025) – what is the phone
number to The Hague, please?
Anyway moving
from that slightly morbid blot now is a good time to touch on interest rates, I
mean what interest rates? For about 17 or so years, the overnight cash rate in
Japan has been set by the Bank of Japan (BoJ) to under 1% per annum in order to
help revitalise the economy (see chart below).This has not quite worked out
(check out chart previously).

Now the
latest Prime Minster Shinzo Abe has promised to combat the deflation of asset
prices in Japan by proposing a 2% inflation target. This would imply making
assets, including Japanese Government Bonds more attractive to purchase. Now we
have touched on the fact that the savings rate in Japan is now under 3%, domestic
purchases would have a band-aid effect, so it would be wise to increase sales
to foreign investors, but again with a declining Yen and next to nothing
interest rates, what can make one more interested in purchasing bonds? One
solution is to increase the yield of return on Japanese Governement Bonds, but
this would imply raising interest rates.
There is a
fundamental problem to this however: Even at these low levels of interest,
25-30% of Japanese tax revenue is spent on servicing only the interest payments
for the bonds. It has been calculated that if interest rates go up to as much
as 2.5%-3.5% per annum, the tax revenue generated would not be enough to cover
the interest payments. At the moment the Japanese tax rate is 5%, with plans to
increase it to 10% by 2015, but even if all Japanese held assets were put to
service the debt issued by the Japanese government and taxes were raised to
100%, it has been forecasted that it would be enough to only service the debt
for another 12 years. Things look terminal at best.
The last
major point I want to look at is Japan’s trade surplus. Before the 2011
Earthquake/Fukushima disaster, Japan had maintained a positive trade balance
due to high volume of exports, as well as low dependency to meet the energy
requirements of the nation due to the development of nuclear reac tors.
Post
Fukushima, however, nuclear reactors were shut down leading to significnat
increases in energy imports, making Japan a net importer as oppose to a net
exporter (see chart below).

Combine that
with a weaker yen to boost exports, increased stimulus to revitalize
infrastructure (20 trillion yen promised by Shinzo Abe), falling exports to
China (it’s largest export partner, and territorial disputes brewing again) and
a downbeat global economy, it Is expected that the deficit will get much wider.
So what is it
that needs to be solved in Japan? Increase economic growth and increase the
value of asset prices. What can be done? Government go beserk, print more
money/issue more JGB at super-low interest rates and devalue Yen to increase
exports. That has been the current policy to date, and clearly has not worked..
So what about stopping the money printing, raise interest rates and increase
the value of the Yen? – As we have seen it is a quick step to sovereign
default. How about re-starting the nuclear reactors? – Not sure if one can
stomach 3-eyed fish. How about addressing xenephobic immigration policies or
increasing incentives to have larger families to increase the proportion of the
working age population? – Wishful thinking, but may be too late to implement as
it is.
If we put the
implications in a global context, consider that Japan is the third largest
economy in the world and holds $4 trillion US dollars in foreign assets. Now
mix with that the crisis in the Eurozone and Helicopter Ben Bernanke continuing
to go wild in the US with the never-ending “quantitative-easing” money printing,
we would most likely see a crisis in the Global Financial Markets unprecedented
in anyones’ time sooner rather than later.
Ah0707 - “Guns and Food (Gold and Silver too)”

Sunday, March 17, 2013
Australian Housing Bubble: You MUST watch this video
There were just a handful of people who predicted the Global Financial Crisis, and this blog follows them all, but there was one man who not only predicted it, but managed to scientifically get nearly every detail of it correct. This man was Steve Keen, Professor in Economics in Western Sydney, Australia. Two years ago he gave a chilling presentation at the mortgage finance association of Australia about the severity of the Australian housing bubble and how the governmenst FHOS (first home owners grants) has every time fooled the innocent minded people of Australia into living in debt for the rest of their lives in over-prices assets.

Over the next week I'm going to by doing some analysis of the key charts you need to know, because this could save your financial future. We are currently at the tipping point of our bubble and have left the illusionary phase and have now entered the denial phase. If you can sell your home now, you will get the highest price for it in real terms then you may ever be able to in your lifetimes. Do yourself a favour and watch THIS VIDEO. I'll be putting up some charts that show in simple terms what's going on in the next few posts.

Saturday, March 16, 2013
Bernanke & Krugman kiss and make up! Also our blog is now on Twitter! @nickj4848
I just love photoshopping these guys and despite their petty bickering in the New York Times, I just can't help but feel that after they finish poisoning the economy with their ideas and destroy us all, that hope is at the end of the tunnel. Let this picture be your inspirational moment of the day! Krugman and Bernanke in love at last!


Feel free to reach me on twitter @nickj4848 or email me nickj4848@gmail.com with your suggestions of what to photoshop next!
Thursday, March 14, 2013
Japan's Imminent Economic Seppuku Will Unleash a Financial Tsunami upon the World
In the coming days our new contributor will be writing about the crisis in Japan. As a precursor to this you should do yourself a favour and check out this recent talk given by Kyle Bass. His company is Hayman
Capital Management. He successfully predicted and benefitted from the subprime mortgage crisis by
purchasing credit default swaps on subprime
securities issued by various investment banks (similar to shorting the bonds). Bass has since continued to attract media attention for his
prediction of the European sovereign-debt crisis and his expectations regarding
Japan's economic future.


Kyle's blog can be found HERE. The blog has most of the transcript from the speech which is similar to one I've heard him give before, but the different audience questions give new insights.
If I had a spare $5 million to invest i'd definitely give it to this guy ($5 million is his minimum client).
If I had a spare $5 million to invest i'd definitely give it to this guy ($5 million is his minimum client).
Basically it boils down to this, Japan is in 1 Quadrillion dollars in debt and is barely able to finance the interest on this debt. Japan has only downsides at the moment because it has a shrinking & ageing population, they import way more then they export, and China is making life difficult for them by boycotting trade. Prime Minister Shinzo Abe and their central bank have decided to print money to stamp out deflation in the hopes of creating growth.
The massive risk (which is not so much a risk as a fact) is that if they do in fact achieve growth and subsequently have to raise interest rates (even fractionally), they will be unable to fund paying the interest on their massive debts. In this situation investors will flee and Japan will have a sovereign debt crisis. Japan is the 3rd largest economy in the world and this will unleash an economic tsunami on the rest of the world, creating even greater stress on a fragile Euro and US economies.
Oh and by the way, Japan has had 10 finance ministers in the past 5 years, a rate of change that hasn't been seen since the fallout from WW2. To give you an idea about how bad the situation is look at this article headline from the end of last year "Japan's Finance Minister Commits Suicide on SuicidePrevention Day"
Or what about this headline about their Brand New Finance Minister "Japan's finance minister tells elderly they should 'hurry up and die' to help reduce country's rising welfare bill"
Or what about this headline about their Brand New Finance Minister "Japan's finance minister tells elderly they should 'hurry up and die' to help reduce country's rising welfare bill"
Anyhow, I thoroughly recommend you watch (or even just listen to) the video and lookup Kyle Bass on Youtube for some great information. Below is a different video of Kyle Bass on youtube it is similar to the one above. You don't get 100,000 hits on youtube for a 1 hour video on economics unless its getting passed around for a reason!
I tried to embed the video but blogspot wouldn't allow me to post it so just click on the link below
Tuesday, March 12, 2013
Bankings Biggest Bitch-Slave and The Man Who Shame-Slapped Them All
In case you forgot about the TARP controversy, Neil Barofsky was the Special United
States Treasury Department Inspector General in charge of overseeing the Troubled
Assets Relief Program (TARP) from a period of late 2008 until his formal
resignation at the end of March 2011. He is an outspoken critic of the TARP
programme and argued for controls on how banks spent their bailout money, but
was ridiculed by his banker bitch-slave peers who felt the banks should not be held to account on
how they spend the bailout money. Barofsky is seen below getting ready to shame-slap Geithner.

He has been described as “one of the most impressive and
courageous political officials in Washington” who is willing to “stand up to
some of the most powerful people and institutions in Washington or on Wall
Street.” Treasury Secretary Geithner allegedly went on a expletive filled rant to Barofsky in private and nearly throttled him.

In the video below Barofsky discusses how a bigger financial meltdown is likely with this corrupt system. This great interview discusses the controversy over banks
being too big to fail and too big to jail, and how governments refusing to
appropriately penalise banks for fraud and malpractice will only lead to
greater risk taking and even more fraudulent behaviour by the banks who
basically have unspoken immunity to law.
Sunday, March 10, 2013
Casey Research & New Contributor
I'm performing more research on the Australian housing bubble, but in the meantime here is a great article done by Casey Research on the fundamentals leading to a coming Bond Market Crash - this further echos my previous posts on the topic.
We are going to see the work of a new contributor to the blog in a week or so, he is a financial analyst with one of the biggest banks, has several degrees and is extremely intelligent. He is preparing an article on the looming Japanese Crisis. So I am very excited to read his article and share it with you all. If you want to contribute on a topic you feel is important then email me on nickj4848@gmail.com
http://www.caseyresearch.com/articles/coming-crash-bond-market

Also be sure to watch Jim Rickards on the Keiser Report early this week. He is writing his second book on the currency wars, and I am very excited to hear more about it. Ill provide a link when its up.
We are going to see the work of a new contributor to the blog in a week or so, he is a financial analyst with one of the biggest banks, has several degrees and is extremely intelligent. He is preparing an article on the looming Japanese Crisis. So I am very excited to read his article and share it with you all. If you want to contribute on a topic you feel is important then email me on nickj4848@gmail.com
http://www.caseyresearch.com/articles/coming-crash-bond-market
Also be sure to watch Jim Rickards on the Keiser Report early this week. He is writing his second book on the currency wars, and I am very excited to hear more about it. Ill provide a link when its up.
Saturday, March 9, 2013
Market Meth: UBS Senior Economist runs out of cocaine and wakes up screaming & Bloomberg News Discovers "Logic" but remains cautiously pessimistic
Firstly I want you to watch this short 2 minute video ... then let me just connect this to what Drew Matus, Senior US economist at UBS has been warning us about treasury auctions....
Below is a chart that produces the most concern for Drew Matus, senior US economist at UBS.


Below is a chart that produces the most concern for Drew Matus, senior US economist at UBS.

Basically the U.S. Treasury issues bonds which are purchased by the Federal Reserve, and the Fed makes a profit on this from the interest paid on these bonds. Now this is no different to you or me purchasing a Treasury issued bond. Basically we help out our country by purchasing its bonds to help finance its debt. This allows the Treasury to deal with the debt, and helps the purchaser of the bonds to make profit from interest on the bond. WIN WIN. Well not quite. In "normal healthy circumstances" the Federal Reserve only purchases small % amounts of bonds from the Treasury, but because the debt is so F%&king huge, the Federal Reserve is now purchasing 90% to help out US deal with its debt and stimulate the economy. But wait, where does the federal reserve get its money from to purchase these bonds???
ANSWER: Magic. Its called "printing money" which these days is Ben Bernanke waking up in the morning putting on his robe and waltzing downstairs to his office and typing in whatever number he feels like whilst still plucking out his nose hairs. That number is now part of the US "money base" .. and he has done this so many times that the money base has gone from $850 billion in 2008, to $3,200 billion as of the end of March 2013. Do you know how insane that is? I'll tell you how much, that's an increase of 377% ... to put that in perspective from 2004 the base went from $400 billion to $850 billion over 4 years and that was considered larger then usual, hmmm i wonder what happened between 2004 and 2008? Before then the monetary base stayed sustainably increasing 15 years from 1989 to 2004, as it should. Chart is below.
Elizabeth MacDonald at Fox Business recently took off her kitchen apron, licked the cookie dough from her fingers and worked out that the rate of increase in the stock markets is directly linked to the increase of the monetary base (article) .... checkout this great chart below she put together.

If Daddy Fed is always going to buy me what I want, it means I never have to work and will forget the value of money!!! Which leads into my next post in a few days on the true impact of unemployment and underemployment of America's youth. I'm also working on a post about the Australian Housing Bubble, and a post about Ben Bernanke called "Vocabulary Easing", this will coincide with the more formal promotion of this blog. For now, please comment or email me nickj4848@gmail.com and enjoy Fox Business Lizzie MacDonald in her kitchen with her husband Fred the Fed.

Friday, March 8, 2013
The Federal Reserve Casino, 3 Strikes and you're out!

Analysis
Debt driven economies, fuelled by extreme reserve bank
stimulus will behave in short but predictable cycles.
As you can see in the above graphs and charts there are 3
main bubbles (the first two have popped obviously) and all have followed a 5
year boom period, followed by a 16-32 month bust period.
I believe we are nearing the peak of the 3rd
bubble, and this time its 3 strikes and the US is out.
I like to use the S&P
500 as my litmus for the state of the economy and historically it has
accurately shown cycles in the economy as well as bubbles.
For more explanation on the S&P:
For more explanation on the S&P:
The S&P 500, or the Standard
& Poor's 500, is a stock market index based on the market capitalizations of 500 leading
companies publicly traded in the U.S. stock market, as
determined by Standard & Poor's. It differs from other U.S. stock market
indices such as the Dow Jones Industrial Average and
the Nasdaq due to its diverse constituency
and weighting methodology. It is one of the most
commonly followed equity indices and many consider it the best representation
of the market as well as a bellwether for
the U.S. economy.[4] The National Bureau of Economic
Research has classified common stocks as a leading indicator of
business cycles.[5] It
is a free-float capitalization-weighted index.[3]
Anyhow getting back to my analysis, the Tech bubble began building pace in 1995 as seen by a steepening of
gains in the S&P 500, this steepening followed a typical bubbles trajectory
and continued at an accelerating pace until early 2000. The bust was slower than
the housing bubble as the US is in less debt then after the housing bubble.
The housing bubble
began partly as a way for the government to repair the economy from the fallout of the
tech bubble, but making easy credit available. Again this followed the same trajectory as any other bubble, and
once it popped the decline was more rapid as this time the debt level was even
higher. The bottom level was also lower.
This time we have a bond bubble. Because the tech bubble decimated
the US populations sharemarket portfolios, and then the housing bubble decimated
their housing assets, it is the bond bubble that decimates the populations
futures. The government is printing money (quantitative easing) and
artificially inflating the share market in the process (more on this in a future post). Because bubbles are proven to be fuelled by government intervention in free markets and then driven by human psychological patterns it is fair to
say this bond bubble phase will behave exactly the same.
My predictions for the next bubble bursting are in red
below.
Start Incline
|
Peak
|
Bubble
Duration
|
Finish Decline
|
Bust
Duration
|
|
Tech Bubble
|
Early 1995
|
Mar 24, 2000
|
5 years
|
Oct 4, 2002
|
2 years, 7 months
|
Housing Bubble
|
Oct 4, 2002
|
Oct 12, 2007
|
5 years
|
March 6, 2009
|
1 year, 5 months
|
Bond Bubble
|
Mar 6, 2009
|
From July 2013 but no later than April 2014 it will peak.
|
5 years
|
Mid 2014 to early 2015
|
9 months approx.
|
Start Price
|
Peak Price
|
End Price
|
|
Tech Bubble
|
500
|
1527
|
801
|
Housing Bubble
|
800
|
1561
|
683
|
Bond Bubble
|
683
|
Approx 1600 – Look for warning signs when
S&P approaches this target.
|
Between 500 - 600
|
This is a great chart from bigtrends.com that exemplifies
the much researched psychology of bubbles. They are more predictable then you
think.

Bubble Chart Source: http://www.bigtrends.com
An interesting psychology occurs when the peak is reached
and the first dramatic drop occurs. There is always a rebound back to near peak
levels after investors enter into ‘denial’ and believe it’s just a blip on the
radar. Above is a chart of a typical bubble cycle and circled in the top in
yellow is what I call the “Correction of Denial.” Below is a breakdown of how
this occurred in the last two bubbles and my prediction for the next.
First Peak
“New Paradigm”
|
Peak Price
|
Correction Rally “Return to
Normal”
|
Rally Price
|
Duration
|
|
Tech Bubble
|
Mar 24, 2000
|
1527
|
Sept 1, 2000
|
1520
|
5 months, 1 week
|
Housing Bubble
|
Oct 12, 2007
|
1561
|
May 16, 2008
|
1425
|
7 months
|
Bond Bubble
|
Once we reach the 1600 mark for the S&P
|
1600
|
3 - 6 months later, but not as big a rally as the other bubbles.
|
1300
approx.
|
3 - 6 months approx..
|
What are your predictions? I'd love to know ... send me an email nickj4848@gmail.com
Wednesday, March 6, 2013
Sex Dolls are Real People and the Dow Jones Hits All Time Highs!!!
 |
| We all know Nobel Prize Laureate Paul Krugman is a ladies man, as he says "real or fake its all the same with love and the markets, I'll get it anyway I can find it." |
Confidence is at historic lows, yet the Stock Markets are at historical highs,
why? FREE MONEY! (for the rich only)
|
October
2007
|
March
2013
|
Dow Jones Industrial Average
|
14164.5
|
14164.5
|
NYSE Average LTM Volume (per day)
|
1300 million
|
545 million
|
Consumer Confidence
|
99.5%
|
69.6%
|
Size of Fed's Balance Sheet
|
$0.89 trillion
|
$3.01 trillion
|
US Debt as a Percentage of GDP
|
38%
|
74.2%
|
GDP Growth
|
+2.5%
|
+1.6%
|
US Deficit
|
$97 billion
|
$976 billion
|
Total US Debt Oustanding
|
$9 trillion
|
$16.7 trillion
|
Unfunded Liabilties
(social security, medicare, Medicaid)
|
$70 trillion
|
$123 Trillion
|
Corporate profits are at all-time highs, but what about everyone
else?
|
||
Corporate
Profits
|
$1500 billion
|
$1750 billion
|
Median
Household income
|
$55,039
|
$49,000
|
Real
Per Capita Income
|
$28,949
|
$26,000
|
Americans Unemployed (in Labor Force):
|
6.7 million
|
13.2 million
|
UNDERemployment Rate U-6
|
8%
|
14.5%
|
Americans On Food Stamps
|
26.9 million
|
47.69 million
|
Median Home Price
|
$230,000
|
$175,000
|
US Poverty Rate
|
$12.5%
|
$16%
|
What
about the rest of the US markets?
|
||
10 Year Treasury Yield
|
4.64%
|
1.89%
|
USD to JPY
|
$1.17
|
$0.93
|
USD to AUD
|
$1.12
|
$0.97
|
Regular Gas Price
|
$2.75
|
$3.73
|
Money Velocity
|
1.9
|
1.55
|
Gold
|
$748
|
$1583
|
Silver
|
$13.50
|
$29.00
|
Subscribe to:
Comments (Atom)